How to Run a Power Analysis
This guide explains how to use GeoLift to evaluate test strength before running an experiment.
Running Power Analysis via CLI
Use the power command to simulate experiments with known treatment effects and calculate the statistical power:
Packaged-install example:
Source-checkout example with the shipped demo config:
Key Flags
--config: Path to the YAML configuration file.--use-gpu: (Optional) Accelerates computation using compatible GPUs.--jobs -1: Uses all available CPU cores for parallel processing.
Built wheel and sdist installs do not include data-config/, so packaged users
should provide their own YAML path.
Expected Outputs
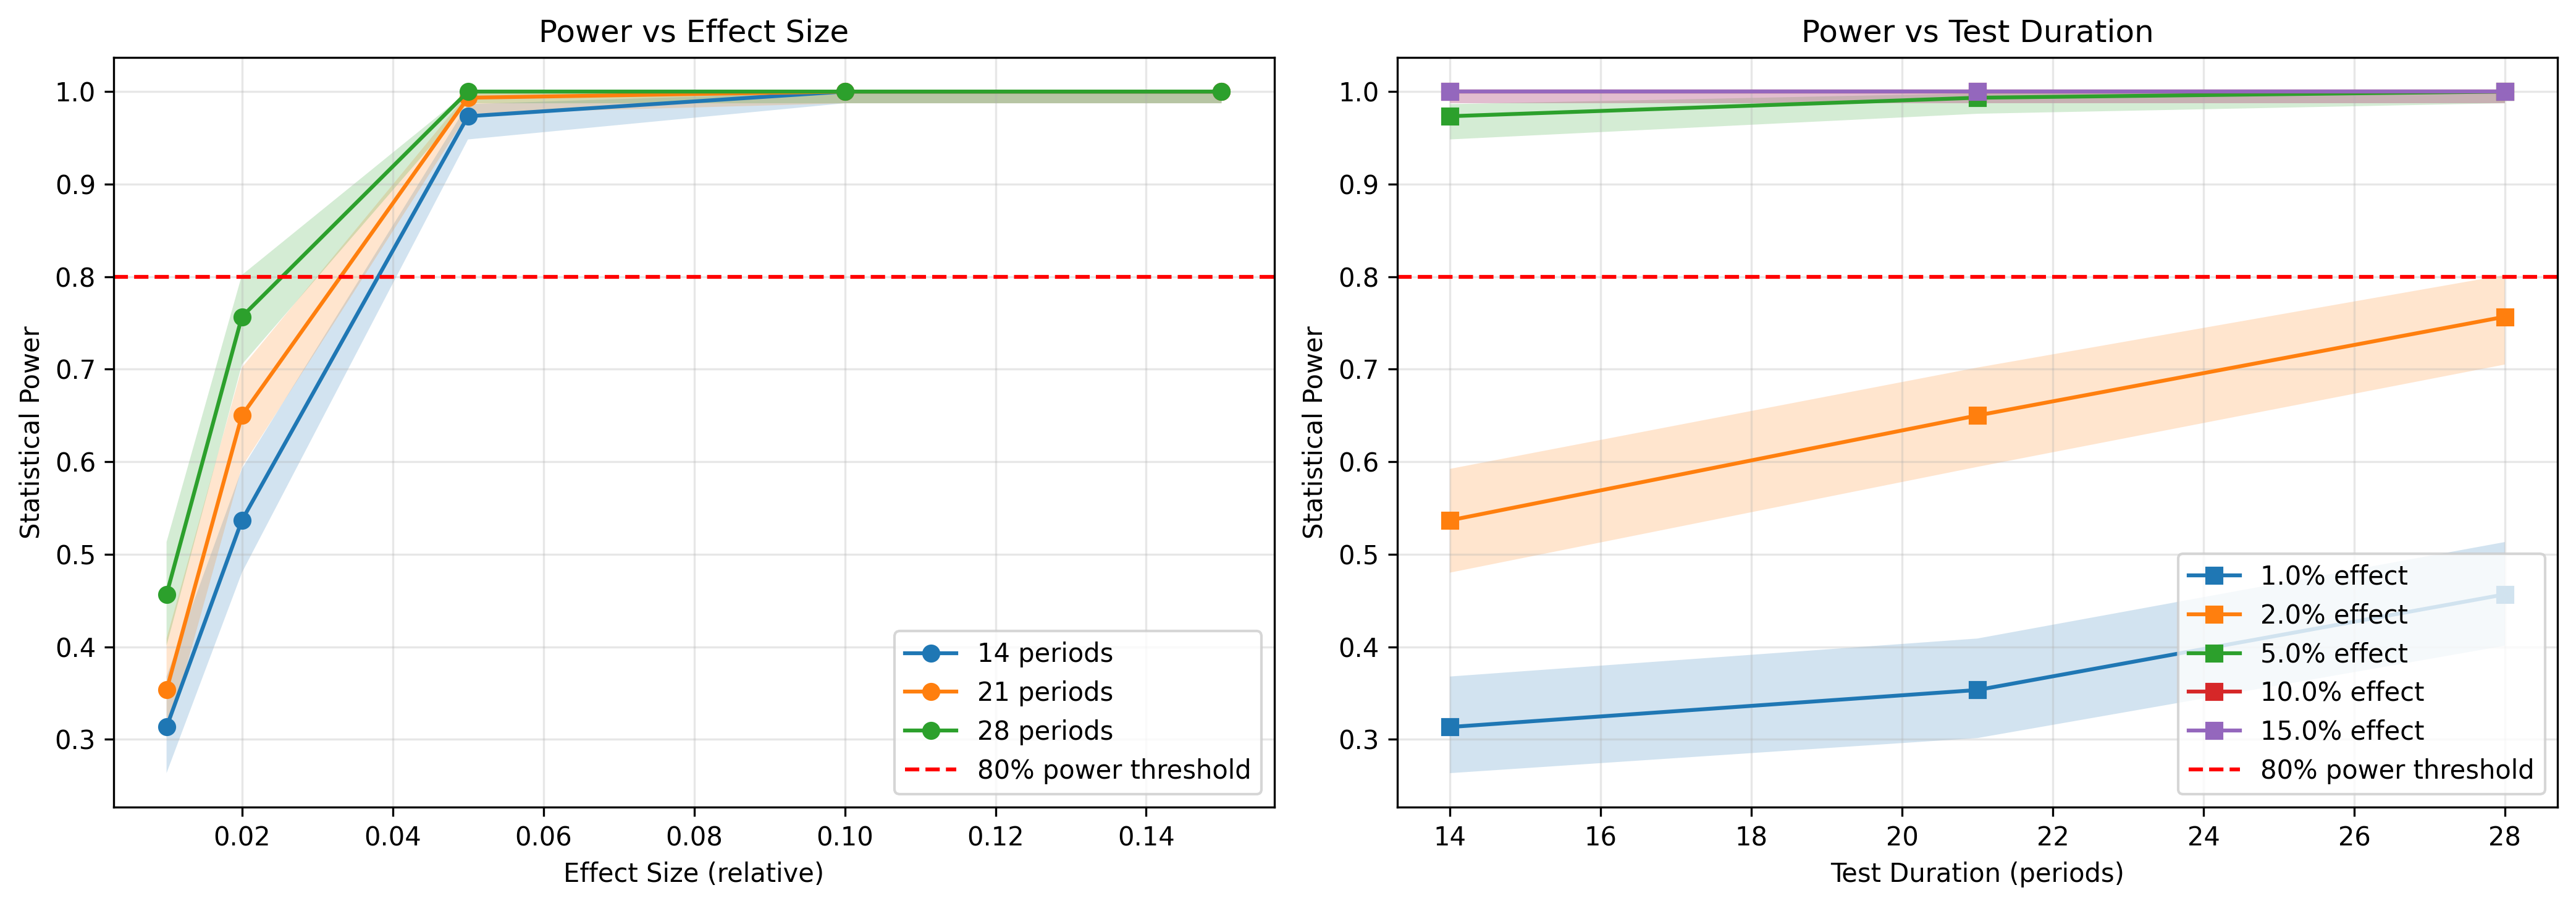
power_analysis_results.csv: Detailed grid of simulated lifts, sample sizes, and resulting statistical power.power_curves.png: Visualization of the power curve across different minimal detectable effects (MDE).
Example Plot
The source-checkout demo workflow ships a representative power-curve output: