How to Run Causal Inference
This guide explains how to measure lift (the actual causal effect) post-experiment using SparseSC.
Running Inference via CLI
Packaged-install example:
Source-checkout example with the shipped demo config:
Key Flags
--data: (Optional) Override the CSV path specified in the YAML.--create-plots/--no-create-plots: Toggle generation of visualization artifacts.
Built wheel and sdist installs do not include data-config/, so packaged users
should provide their own YAML path.
Expected Outputs
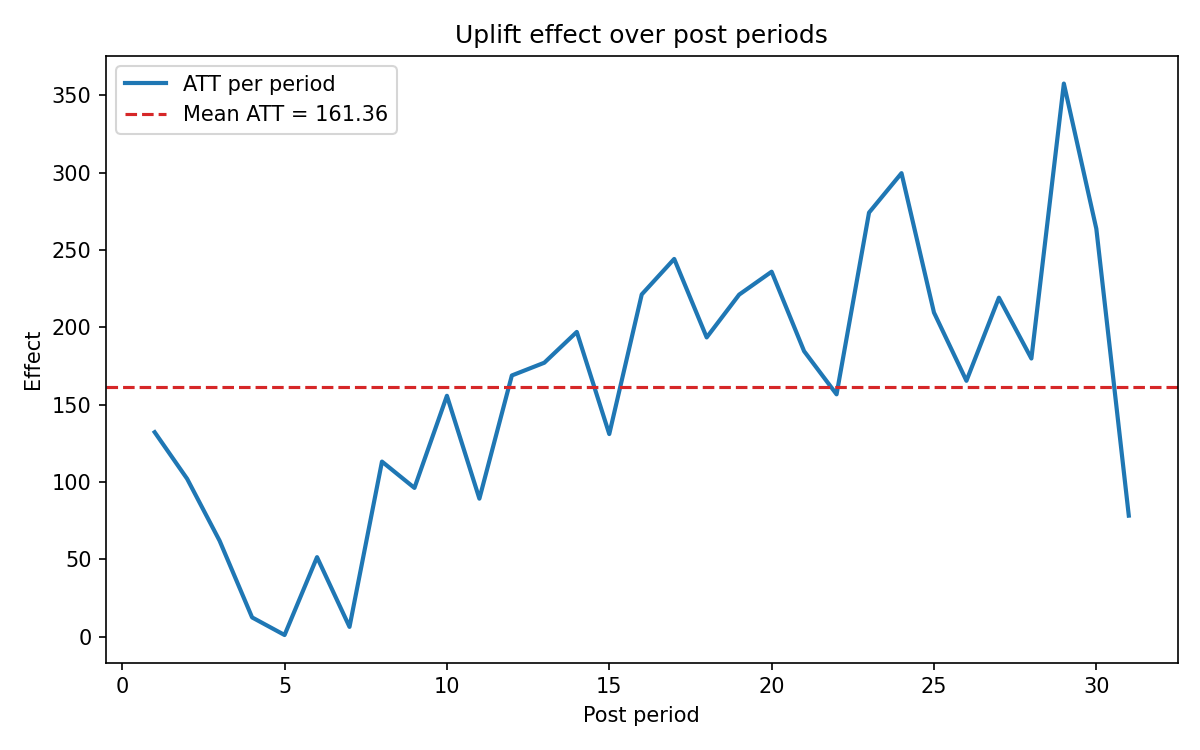
geolift_results.json: Top-level statistical results including ATT, p-value, and confidence intervals.geolift_diagnostics.json: Deep diagnostic metrics for the synthetic control fit.uplift_timeseries.png: Visual comparison of the treatment unit vs. the synthetic control over time.
Example Plot
The source-checkout demo workflow ships an uplift time-series plot that works well as documentation context: